Open source · MIT · $0 to run
One US map engine. Any dataset, as a layer.

41 real, free, keyless datasets across the full 512-city US spine. Add any of them as a layer, stack as many as you want, click a city — the same rendering pipeline drives every one of them, because every dataset speaks one small, shared interface. No dataset-specific map code, ever.

tools.mdostal.com/mapstack
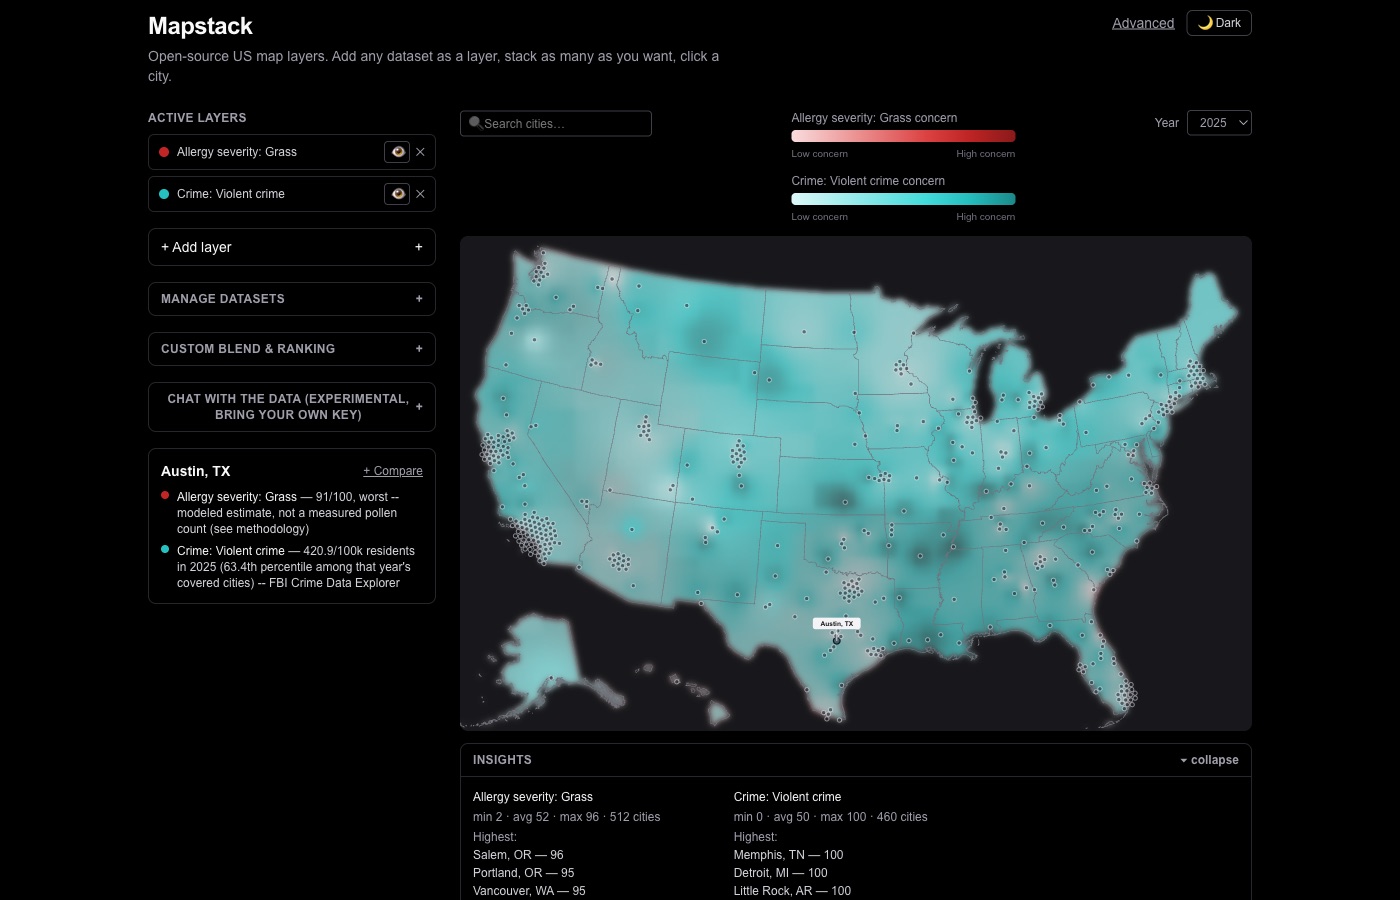
Mapstack showing Austin, TX with two stacked layers active -- allergy severity and violent crime -- each with its own legend, year control, and a city detail panel citing its real source.

Two real datasets stacked on one map -- allergy severity and FBI violent-crime rates -- each with its own legend, year control, and a sourced detail line. Live at the link above.

Origin

Born from a real product, not designed on a whiteboard

Allergy Locator shipped first: a full, validated US allergy-severity map with real ground-truth data, county-level gradients, and day-by-day forecasting. Once a second real dataset (healthcare access — nearest hospital by drive time) got built the same way inside that project, the shared shape between the two became clear enough to actually generalize — rather than guessing at an abstraction from a single case.

Predecessor Allergy Locator
This repo Mapstack

The full reasoning behind the split lives in Allergy Locator's own writeup.

The interface

Add a dataset by implementing one small contract

Every dataset — no matter how different its underlying data looks — implements the exact same shape: a fixed list of layers, an optional list of real years it has history for, and a lookup that returns a 0–100 value on a shared "higher = more concerning" scale, plus a one-line human-readable detail.

// lib/datasets/types.ts
interface Dataset {
  id: string;
  label: string;
  layers: DatasetLayer[];
  supportsTime: boolean;
  availableYears?: number[];  // real years only, e.g. crime's [2020..2024]
  getValue(cityId, layerId, context?): {
    value: number;   // 0-100, higher = more concerning
    detail: string;  // "72/100, high" or "Bellevue Hospital, 4 min"
  } | null;         // null = a real gap, never a fabricated value
}

That's it. Implement getValue, register the dataset once, and the exact same MultiLayerMap/AddLayerPanel components render it — continuous gradient, click-to-select detail panel, legend, a year control if it has real history, all of it — with zero new rendering code. Any number of layers from any number of datasets can be active on the map at once, each stacked as its own gradient (Allergy Locator's proven stacked-opacity pattern, generalized across datasets instead of just allergens).

What's real today

Forty-one genuinely different real implementations

All free, all keyless, across the full 512-city spine — every one of them ships its own methodology doc naming its real sourcing and honest gaps. A few that show the sourcing rigor best:

Allergy severity live

Ported from Allergy Locator's own validated grass ground-truth (MAE 2.3) plus 28 modeled allergens.

Crime live

Real violent- and property-crime rates from the FBI Crime Data Explorer, with genuine 2020–2025 year-by-year history.

Electoral competitiveness live

Real 2024 county election margins (MEDSL) — competitiveness, deliberately not a left/right lean score. A real "TOTAL VOTES CAST" sentinel-row bug in WI/SC's raw data was found and fixed, not papered over.

Historic site access live

National Register of Historic Places, joined by a live server-side spatial radius query — one HTTP call per city, no bulk download.

Superfund site density live

EPA Superfund sites near each city — correctly labeled as a "Parish" in Louisiana instead of assuming "County" everywhere.

Severe weather frequency live

NOAA Storm Events Database. An in-progress year is disclosed as real partial-year coverage in its own detail text, never shown as a false zero.

Care access live

Nearest hospital by real drive time — general, pediatric specialty, and pediatric cardiac surgery.

Broadband access live

Real Census ACS broadband-subscription rates, via County Health Rankings' free republication — full 512-city coverage.

Measured grass pollen live

REAL, measured elevated-grass-pollen-day counts from a real county health station — not modeled. Intentionally sparse (7/512 cities) rather than a fabricated national estimate.

Every dataset, every real source — named

In the spirit of the "never fabricate, always disclose" rule this whole project runs on: all 41, with exactly where their numbers come from.

Allergy severityPorted from Allergy Locator's validated grass model + Köppen-zone climate modeling
Care accessCurated hospital facility lists, ported from Allergy Locator
Natural hazard riskFEMA National Risk Index
Social vulnerabilityCDC/ATSDR SVI
Health outcomesCDC PLACES
Housing supplyZillow Research Data
Housing market speedZillow Research Data
Electoral competitivenessMIT Election Data + Science Lab
Broadband accessCounty Health Rankings (Census ACS republication)
Median household incomeCounty Health Rankings (Census ACS republication)
Housing affordabilityCounty Health Rankings (Census ACS republication)
Winter cold burdenNOAA NCEI Climate Normals
State income taxTax Foundation
Population changeCensus PEP + ACS, stitched across 3 real vintages
Measured grass pollenVermont Dept. of Health EPHT Pollen (ArcGIS FeatureServer)
Superfund site densityEPA Envirofacts (SEMS)
Environmental violationsEPA ECHO
Industrial facility densityEPA Toxics Release Inventory
Severe weather frequencyNOAA Storm Events Database
Drought severityUS Drought Monitor (NOAA/USDA/UNL)
Business densityCensus Business Patterns
School spendingUrban Institute Education Data Portal (NCES CCD)
Gigabit availabilityFCC National Broadband Map

Every row above links to the real, live, public source it was fetched from — no scraping behind a login, no purchased panel data. Full sourcing detail, real coverage numbers, and known gaps for each one live in this repo's own data/*-methodology.md files.

Beyond the map

The same real data, from more angles

Power-user comparison view

A sortable, filterable table across every dataset and every city at /advanced, with CSV export, saved views, and a live custom-blend formula editor across any 2+ layers.

Chat with the data

Bring your own API key — Anthropic, OpenAI, or Google — and ask questions in plain language. The model calls the same read-only functions the map itself uses; it never sees or stores your key server-side.

MCP server

The same closed, read-only tool set the in-app chat uses, exposed over stdio for Claude Desktop, Claude Code, or any MCP-compatible agent — runs entirely on your own machine, no hosting, no secrets.

Per-dataset real history

Wherever a source actually publishes multiple years, the year control is live — not interpolated or backfilled, only years the source itself reports.

What's next

Roadmap

Forty-one real datasets— live, free, keyless, full 512-city spine
Power-user comparison view— sortable/filterable table, CSV export, saved views, live formula editor, a user-defined custom blend across any 2+ layers
Chat with the data— bring-your-own-key across Anthropic, OpenAI, and Google, plus an MCP server exposing the same tools locally
Per-dataset year control— live wherever a dataset reports real availableYears
Manage datasets— hide layers you don't care about from the picker, without touching layers already on the map
Full Census-cluster resolution— population, broadband, income, housing-cost-burden, and property tax all now real and live, the last (population/property tax) unblocked by a free Census API key
01More free, keyless datasets— a ranked backlog of further real candidates by real-world feasibility
Support

Support this project

Free and open source, always. A few ways to help — or just say hi: use it, star it, file an issue (honestly the best support an open-source project can get), hire me for fractional-CTO and consulting work, or buy a coffee if it saved you time.

More tools like this: tools.mdostal.com · life outside the terminal: life.mdostal.com · what we're building at Firefly Events (event discovery, 8,000+ events/day from 7+ sources): ff.events. Always up for a conversation if any of it's useful to you.